將一筆衛星資料,畫出一筆灰階的衛星雲圖。
下載資料
從日本日本高知大學衛星資料庫下載一筆資料。 選取檔案格式為Geo-coordinate mapped data for GAME research area. N70 - S20, E70 - E160. 1/20 degree resolution. 1800 x 1800 pixels. PGM (Portable Gray Map) format with Gzip compression.的資料。
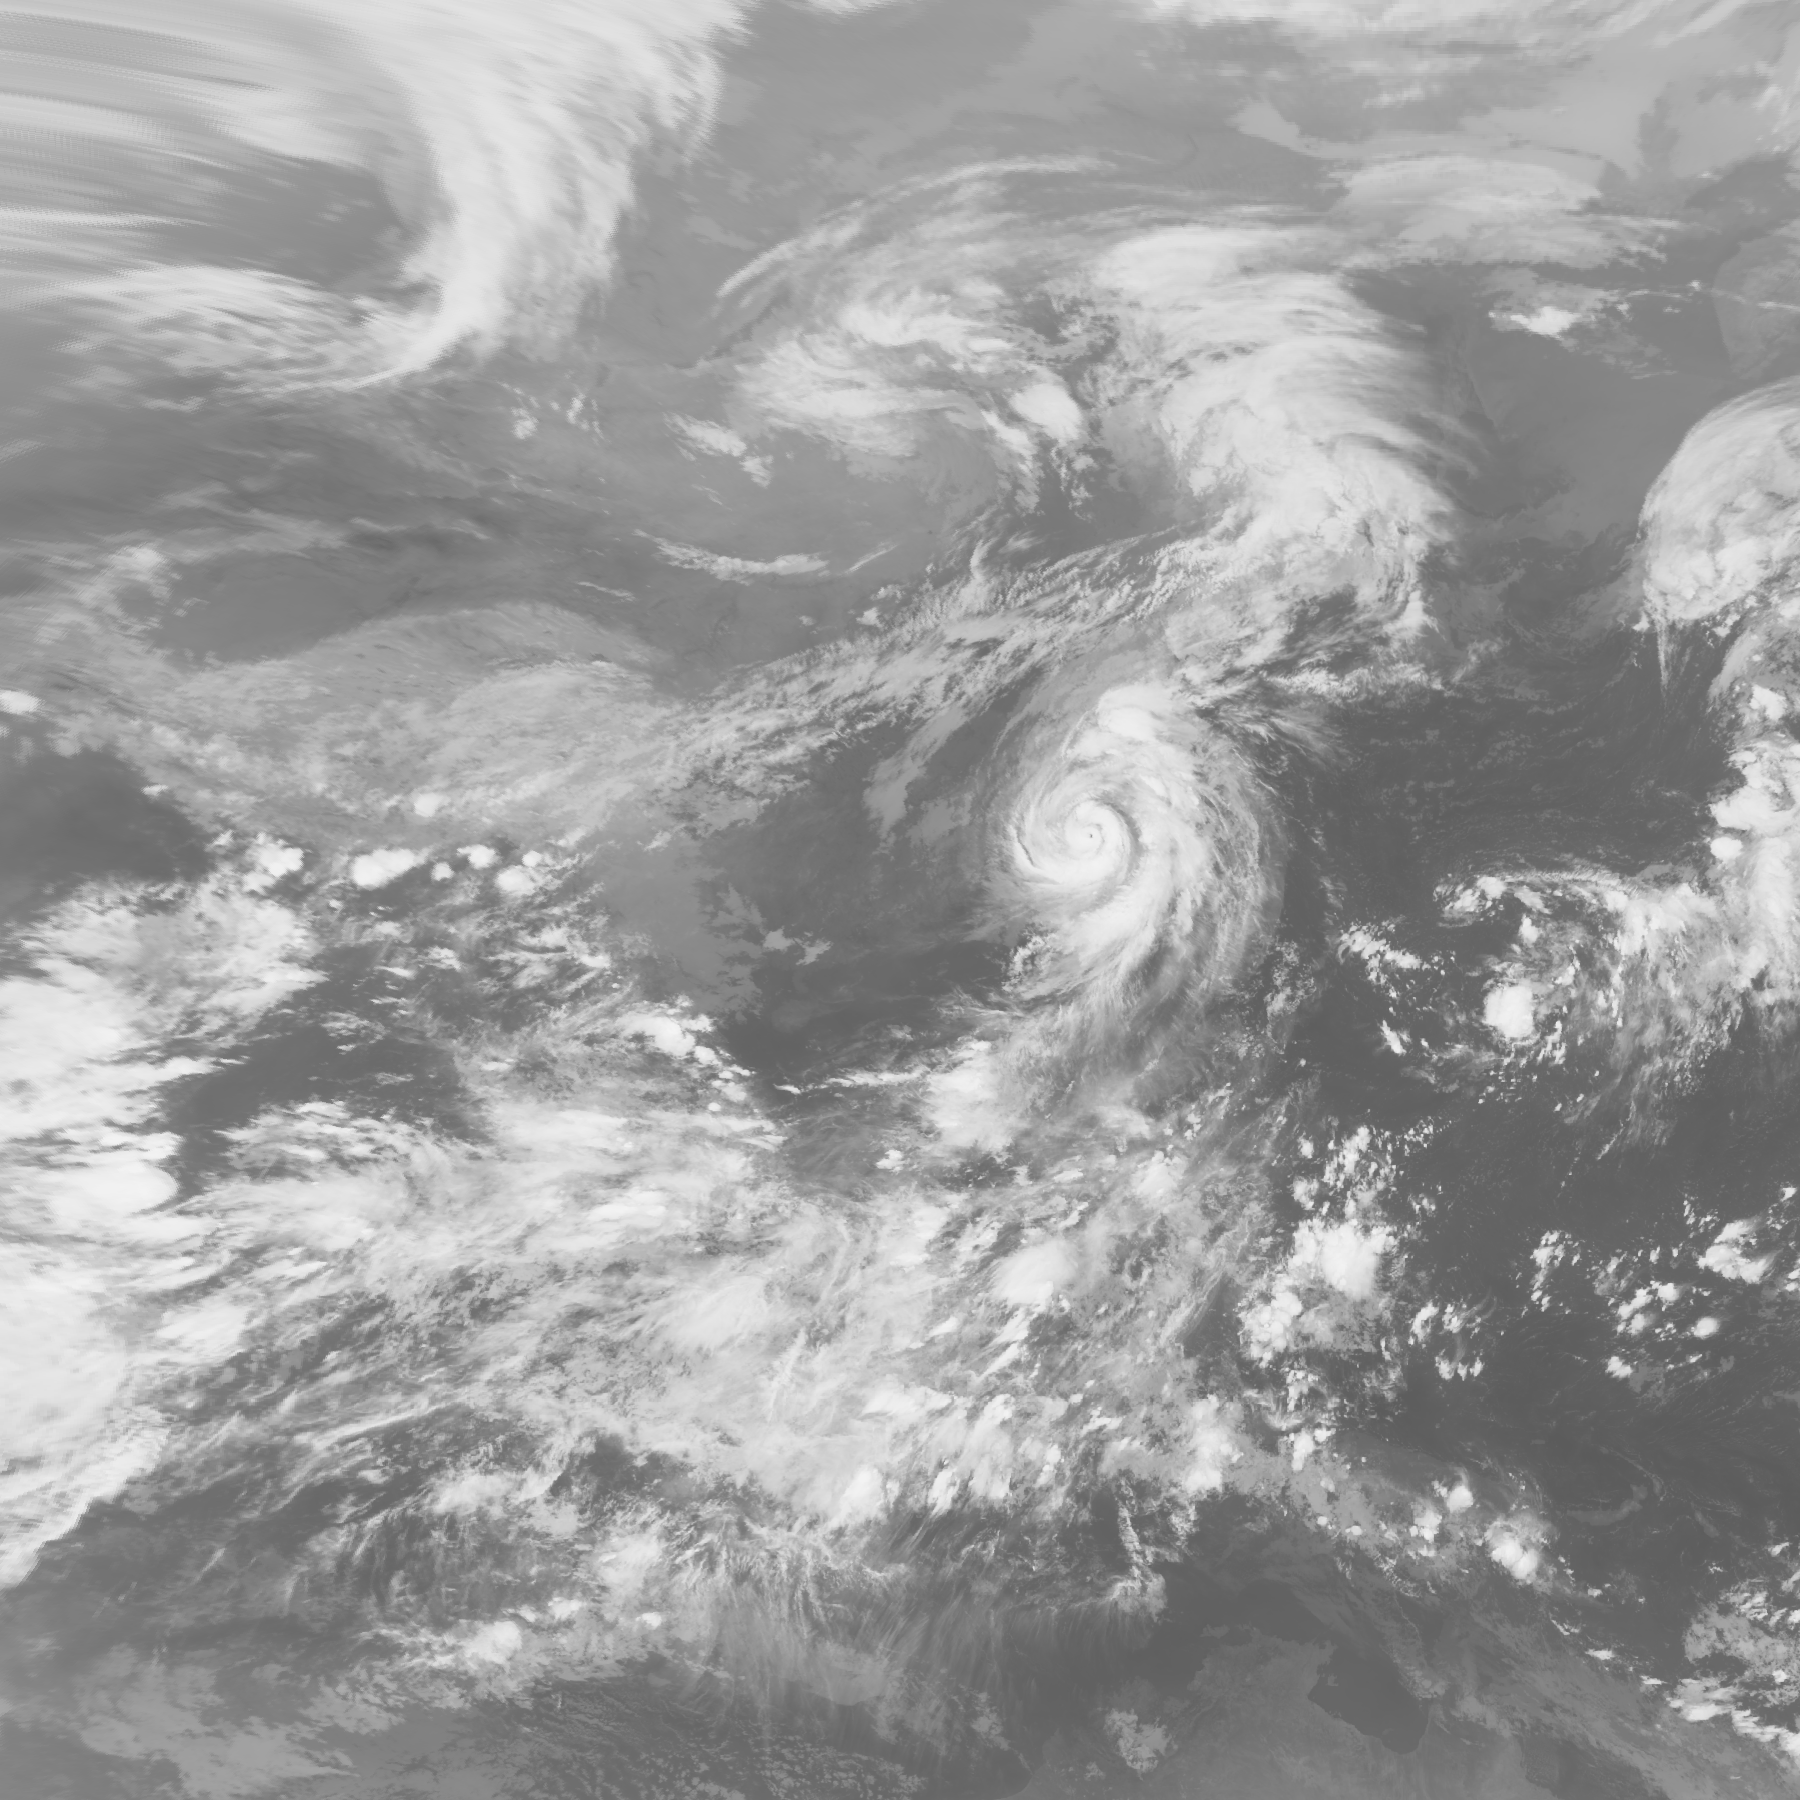
選一個紅外線頻道IR1的資料,就選上週的軒蘭諾颱風。有兩種讀寫方式,第一種是直接用PIL讀取,讀進來的格式直接就是圖形的物件。
from PIL import Image
PGMFile='HMW822090416IR1.pgm'
imgS = Image.open(PGMFile)
imgS.save('IR_202209041600.png')
輸出的圖檔如下:
另外一種方式是用numpy讀進來,再把numpy的array轉換成image的物件。
rom PIL import Image
import numpy as np
PGMFile='HMW822090416IR1.pgm'
cntS = np.fromfile(PGMFile,dtype='uint8')
dsize=1800
arraysize=dsize*dsize
cntS = cntS[-arraysize:] #檔頭去掉,留下資料的部份
cntS = cntS.reshape((dsize,dsize)) #資料轉換成2維的array
ImageS = Image.fromarray(cntS,'L') #array轉換成單層(灰階)的圖形物件
ImageS.save('IR_202209041600-2.png')
首先,我們知道高知大學提供的這筆資料是1800x1800pixels,然後也知道pgm格式是檔案開有一行檔頭,於是需要做個手腳,把檔頭去掉,留下資料的部份。當然,輸出的圖會跟第一種方式一模一樣。


沒有留言:
張貼留言